Zoomable Pictures of the Chapter 11 Spreadsheet Figures
There is a lot of information in the chapter 11 figures showing the Technology Radar spreasheet. Here are zoomable versions.
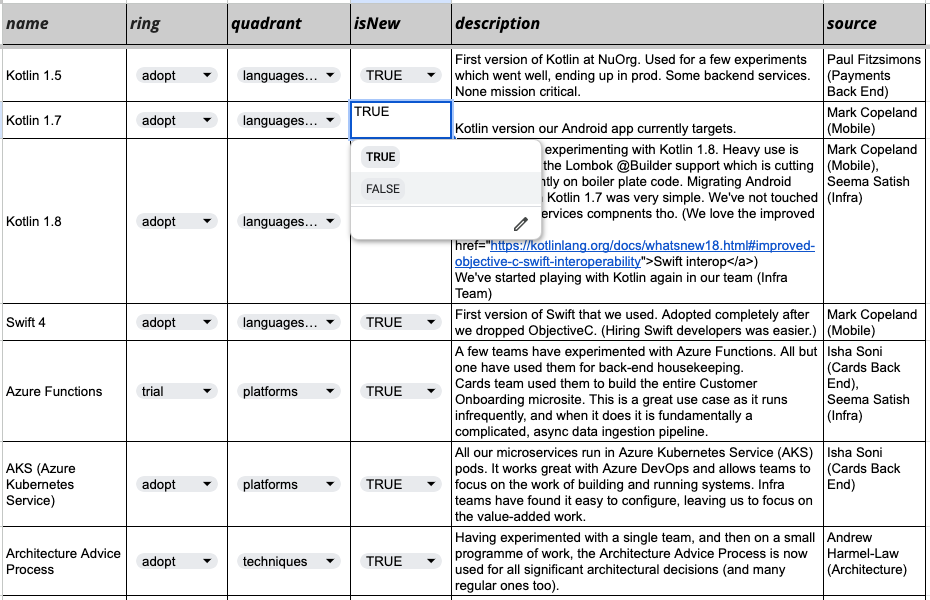
Figure 11-4
A Google spreadsheet used to gather blips containing some example data in each of the fields.
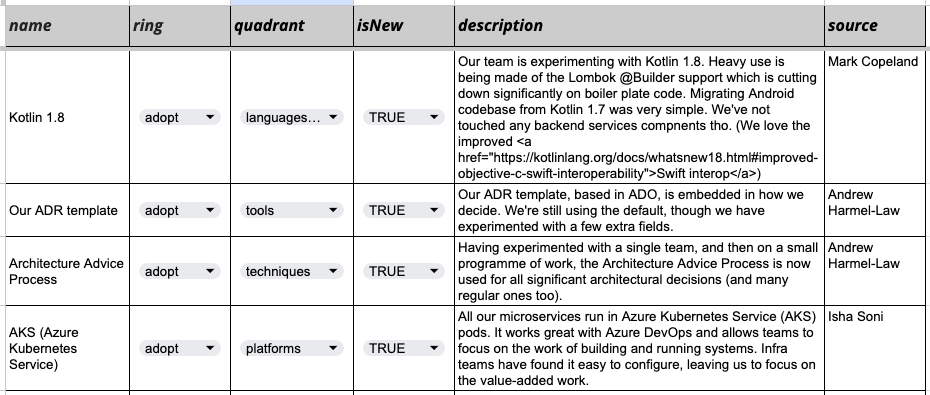
Figure 11-5
Selection of raw, unsorted blip data after gathering but before sorting and filtering, focusing, and positioning.
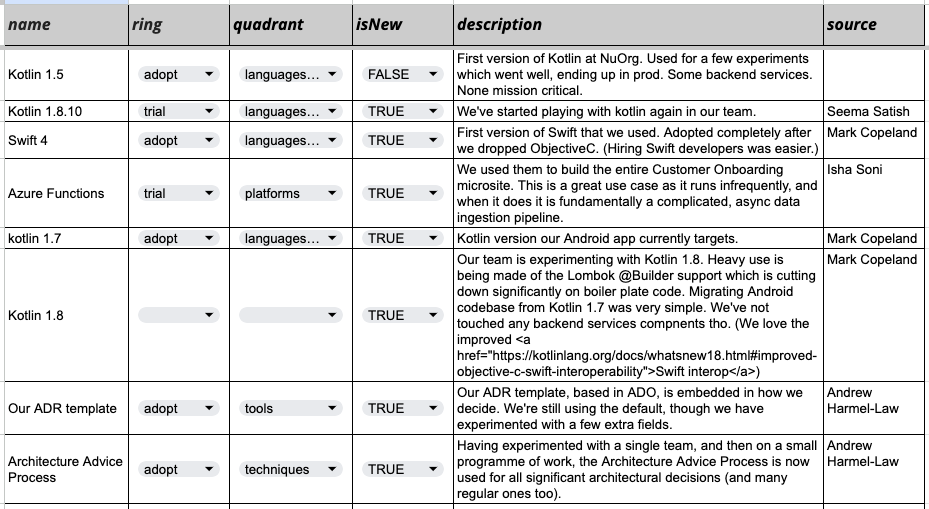
Figure 11-6
Selection of sorted and filtered blip data, ready for focusing and positioning.
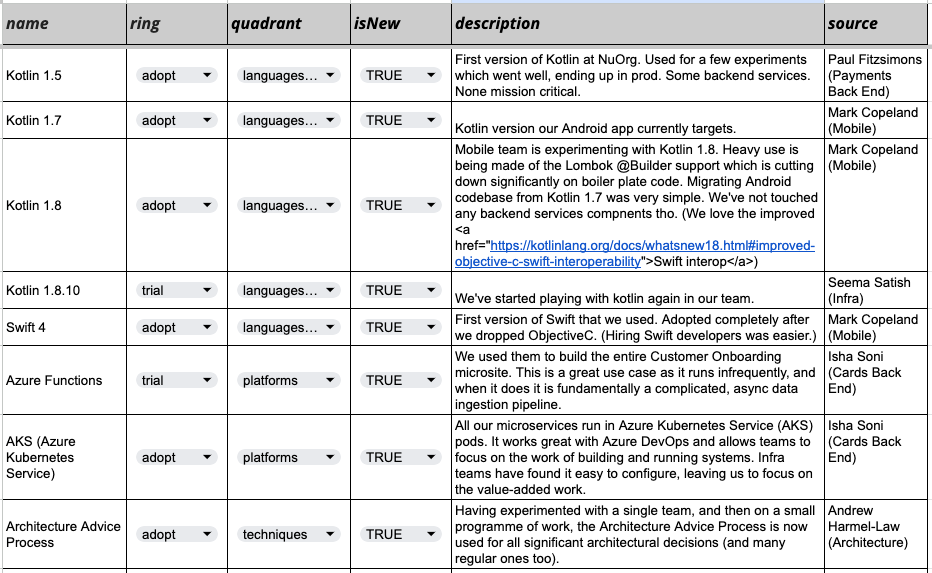
Figure 11-7
Selection of focused blips.
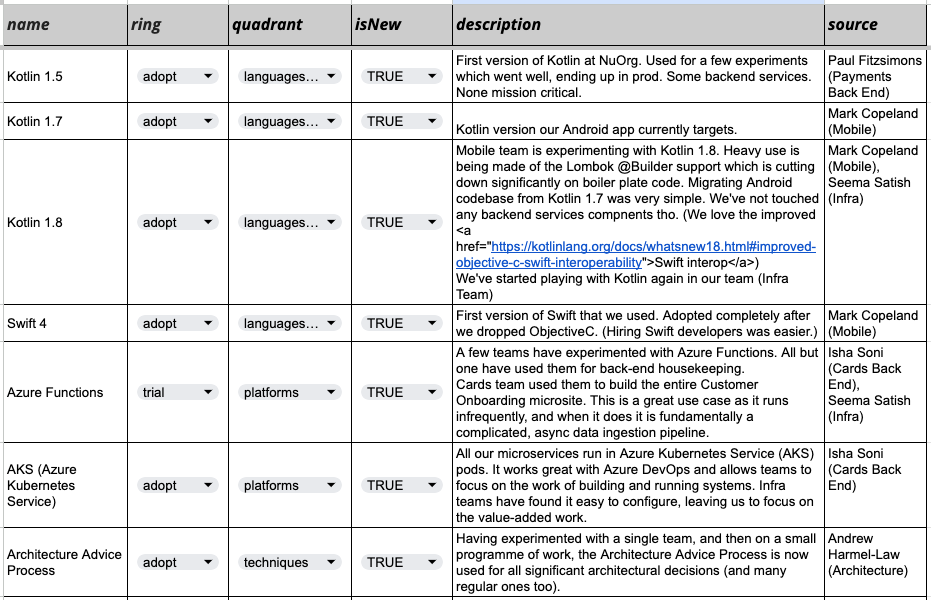
Figure 11-8
Selection of blips and their votes (“description” and “source” columns hidden).
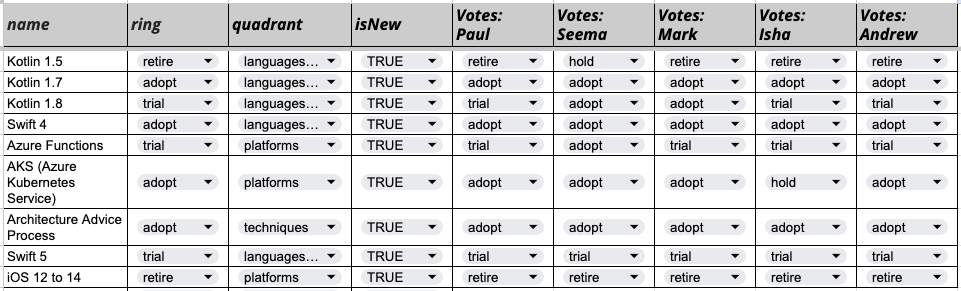
Figure 11-10
Setting the blips from the last edition of your radar to “isNew=false”.